
Difficult
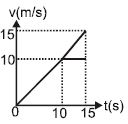
$A$ particle starts from rest and undergoes an acceleration as shown in the figure. The velocity-time graph from the figure will have which shape?
- A
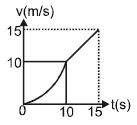
- B
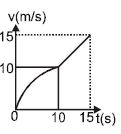
- C
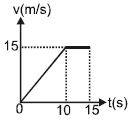
- D
Explore More
Similar Questions
What is common in the two graphs given below?
Medium
View SolutionConsider a car initially at rest,starts to move along a straight road first with acceleration $5 \ m \ s^{-2}$,then with uniform velocity and finally,decelerating at $5 \ m \ s^{-2}$,before coming to a stop. Total time taken from start to end is $t = 25 \ s$. If the average velocity during that time is $72 \ km \ hr^{-1}$,the car moved with uniform velocity for a time of: (in $s$)
$Assertion$ : Velocity-time graph for an object in uniform motion along a straight path is a straight line parallel to the time axis.
$Reason$ : In uniform motion of an object velocity increases as the square of time elapsed.
$Reason$ : In uniform motion of an object velocity increases as the square of time elapsed.
The maximum possible acceleration of a train moving on a straight track is $10\ m/s^2$ and the maximum possible retardation is $5\ m/s^2$. If the maximum achievable speed of the train is $10\ m/s$,then the minimum time in which the train can complete a journey of $135\ m$ starting from rest and ending at rest is.........$s$.
Medium
View SolutionThe velocity-time graphs of a car and a scooter are shown in the figure. $(i)$ The difference between the distance travelled by the car and the scooter in $15\, s$ and $(ii)$ the time at which the car will catch up with the scooter are,respectively:
DifficultJEE MAIN 2018
View SolutionVedclass Products
For Students
Vedclass Test Series
Mock tests in real JEE/NEET style with performance analysis. 5-day free trial.
Start Free TrialFor Teachers
Exam Paper Generator
Generate Set A/B/C/D exam papers from 7.5L+ questions in 2 minutes. 3 chapters free.
Try FreeFor Institutes
Online Exam Module
Live online exams with unlimited students, 360° analytics & white-label branding.
See Demo